Section 3 CNV and prognosis
3.1 Differential CNV
We classified 608 PAAD patients into two groups according to CNV: the first group (CNV-G1 with 321 patients) versus the second group (CNV-G2 with 287 patients). We performed differential CNV analysis identifying 155 genes with higher CNV in CNV-G1 than in CNV-G2, and 215 genes with higher CNV in CNV-G2. These 215 genes with higher CNV in CNV-G2 are mostly of functional relevance to DNA repair, including 11 HRR genes (ATM, ATR, BLM, BRCA1/2, BRIP1, CHEK2, PALB2 and RAD51B/51C/51D). These analyses reveal that CNV-G2 patients seemed to obtain an enhanced function of DNA repair (likely HRR), while CNV-G1 patients possessed more depleted DNA repair genes. For convenience, we renamed CNV-G2 as ‘repair-proficient’, and CNV-G1 as ‘repair-deficient’.
List of genes with differential CNV comparing CNV-G1 against in CNV-G2, with the column
log(G1 / G2)indicative of log-transformed differential change.
3.2 Prognosis
As shown in the left panel of the figure below, patients in CNV-G2 (repair-proficient) had a worse prognosis than patients in CNV-G1 (repair-deficient).
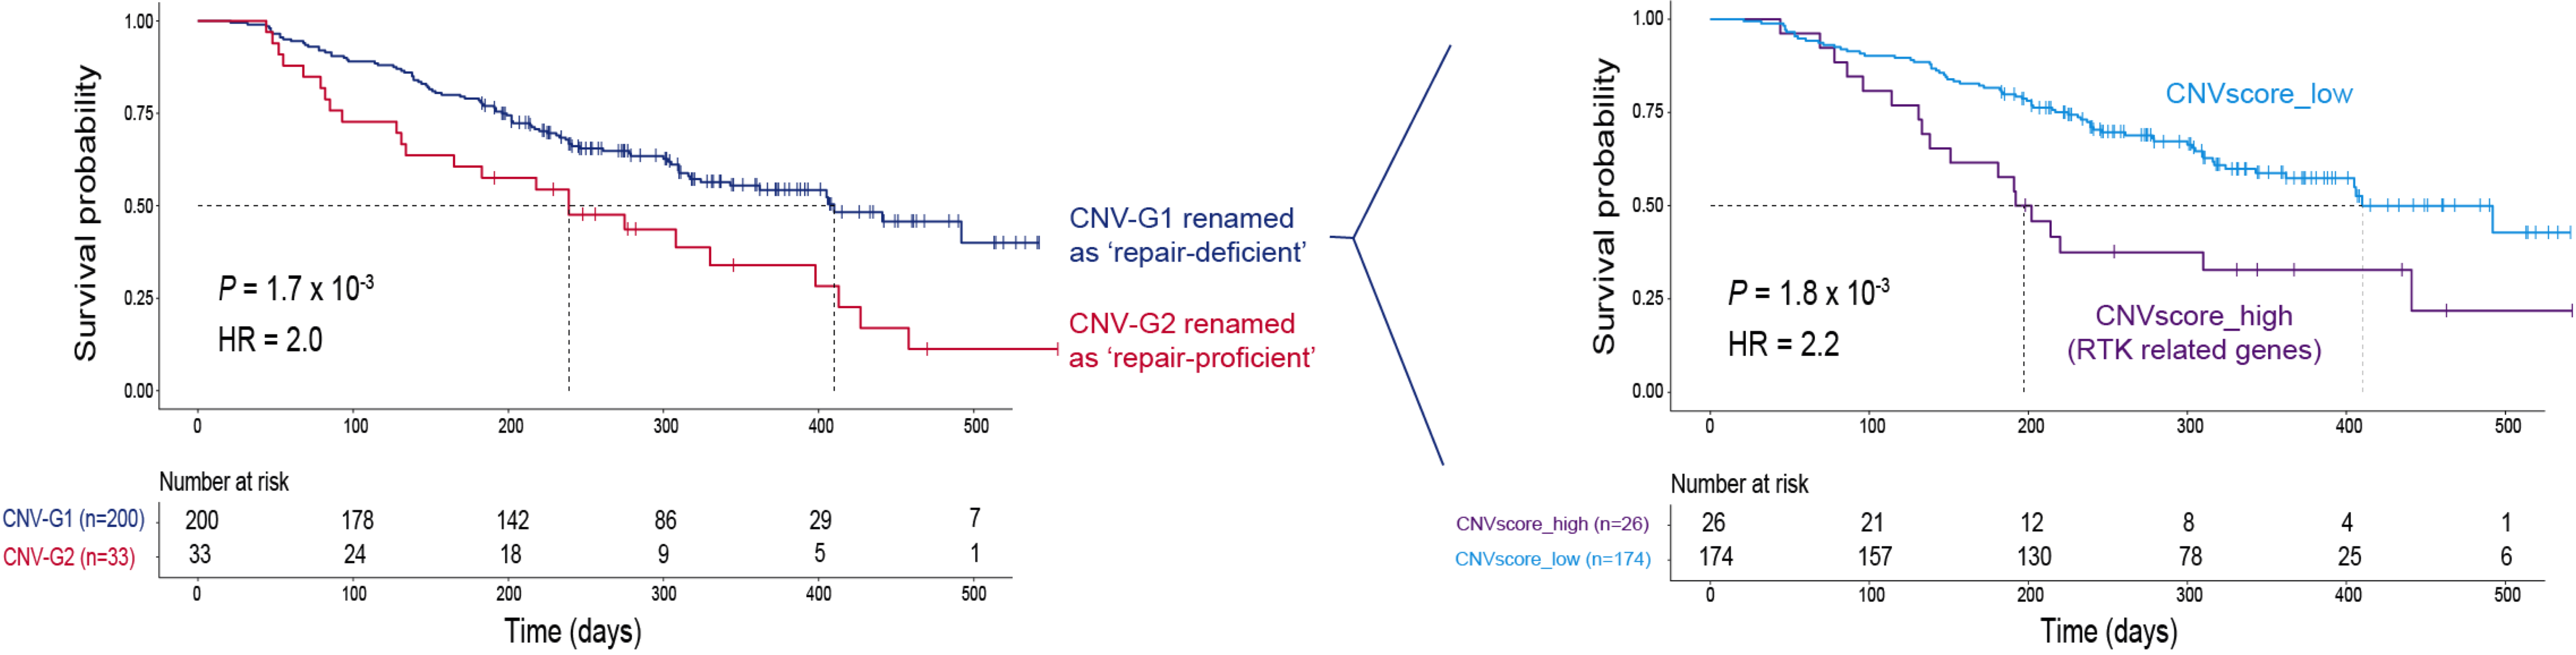
Given the fact that patients in CNV-G1 (repair-deficient) formed a large group in number, we partitioned these patients into two subgroups: one subgroup with high CNV score, and the other subgroup with low CNV score. Comparing repair-deficient patients with high or low CNV score, we identified 203 genes with differential CNV. Genes with higher CNV (in the patient subgroup with higher CNV score) were largely involved in the RTK related signaling pathways. As shown in the right panel of the figure above, worse prognosis was significantly associated with the subgroup with high CNV score as compared to the subgroup with low CNV score.