Section 2 Genetic prioritisation
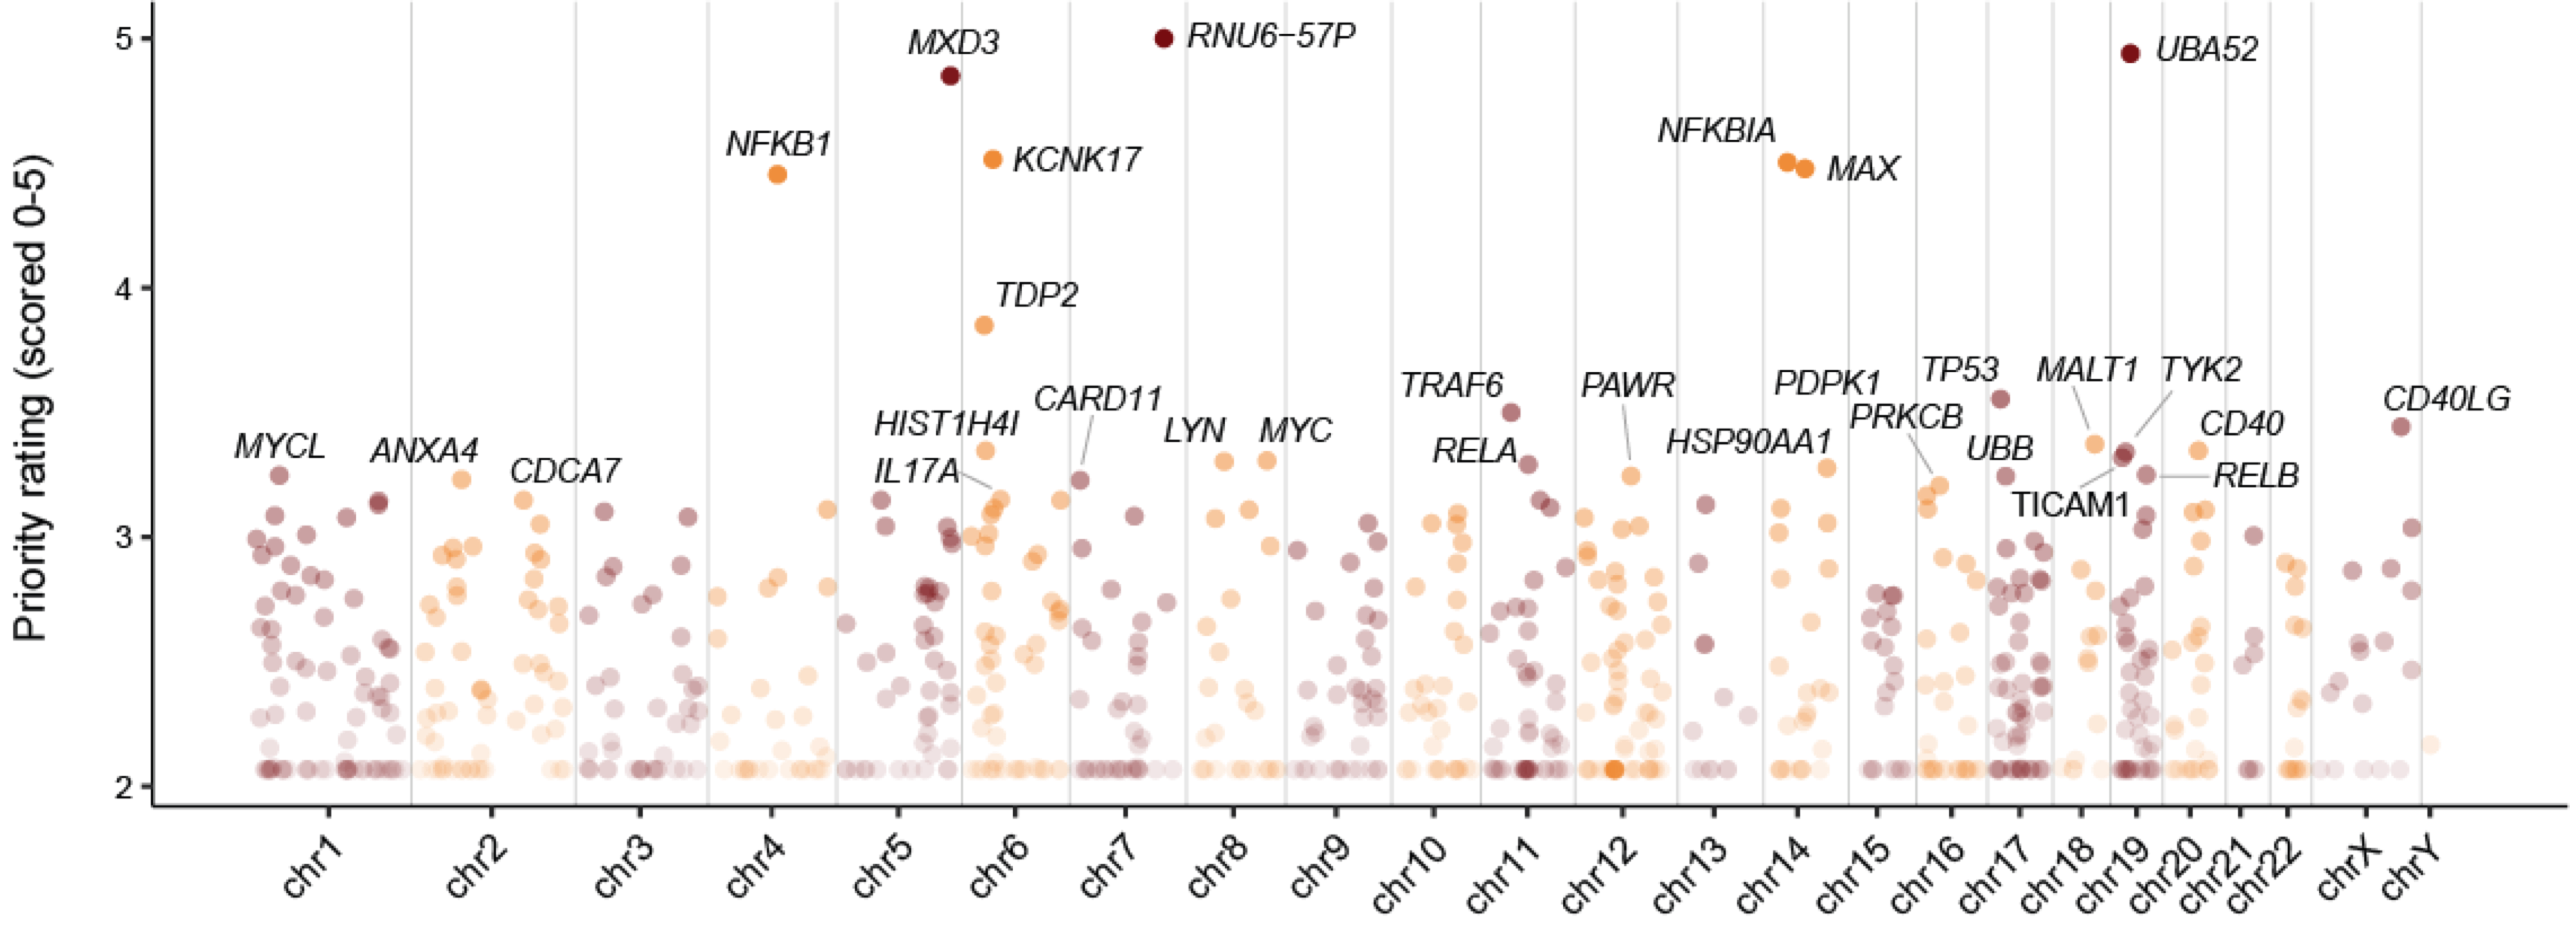
Figure 2.1: Manhattan plot illustrates priority rating (y-axis) for prioritised target genes (color-coded by chromosomes; x-axis), with top 30 genes named.
2.1 Package installation
# if BiocManager not installed, please do so:
install.packages('BiocManager')

# then, install packages Pi and tidyverse
BiocManager::install(c('Pi','tidyverse'))
2.2 Do prioritisation
# load packages
library(Pi)
library(tidyverse)
RData.location <- "http://galahad.well.ox.ac.uk/bigdata"

# read GWAS summary data
data.file <- file.path(RData.location, "KSD_gwas_data.txt.gz")
data <- read_delim(data.file, delim='\t') %>% as.data.frame()

# pre-define parameters and built-in datasets
guid <- 'gskpn'
LD.customised <- xRDataLoader('GWAS_LD', guid=guid)$EUR %>% xSM2DF()
significance.threshold <- 5e-8
distance.max <- 2000
decay.kernel <- "constant"
GR.SNP <- xRDataLoader('dbSNP_GWAS', guid=guid)
GR.Gene <- xRDataLoader('UCSC_knownGene', guid=guid)
include.TAD <- "GM12878" # lymphoblast, reflective of immune-context genomic
include.HiC <- c("Monocytes","Macrophages_M0","Macrophages_M1","Macrophages_M2","Neutrophils","Megakaryocytes","Endothelial_precursors","Erythroblasts","Fetal_thymus","Naive_CD4_T_cells","Total_CD4_T_cells","Activated_total_CD4_T_cells","Nonactivated_total_CD4_T_cells","Naive_CD8_T_cells","Total_CD8_T_cells","Naive_B_cells","Total_B_cells")
include.eQTL <- c("Blood","CD14","CD4","CD8")
network.customised <- xDefineNet(network="STRING_high", STRING.only=c("experimental_score","database_score"),  RData.location=RData.location) %>% dNetInduce(nodes_query=names(GR.Gene), knn=0, largest.comp=F)

# prepare predictors
ls_pNode_genomic <- xPierSNPsAdvABF(data, LD.customised=LD.customised, significance.threshold=significance.threshold, distance.max=distance.max, decay.kernel=decay.kernel, decay.exponent=decay.exponent, GR.SNP=GR.SNP, GR.Gene=GR.Gene, include.TAD=include.TAD, include.HiC=include.HiC, include.eQTL=include.eQTL, network.customised=network.customised, RData.location=RData.location)

# Prioritisation
ls_pNode <- Filter(Negate(is.null), ls_pNode_genomic)
dTarget <- xPierMatrix(ls_pNode, displayBy="pvalue", aggregateBy="fishers", RData.location=RData.location)

# write into a file 'KSD_priority.txt.gz'
dTarget$priority %>% select(name,rank,rating,description) %>% write_delim('KSD_priority.txt.gz', delim='\t')
2.3 Prioritised genes
Target genes stored in the output file KSD_priority.txt.gz above can be explored below. Notes, genes are ranked by priority rating (scored 0-5; see the column Rating).