Section 4 Cellular basis

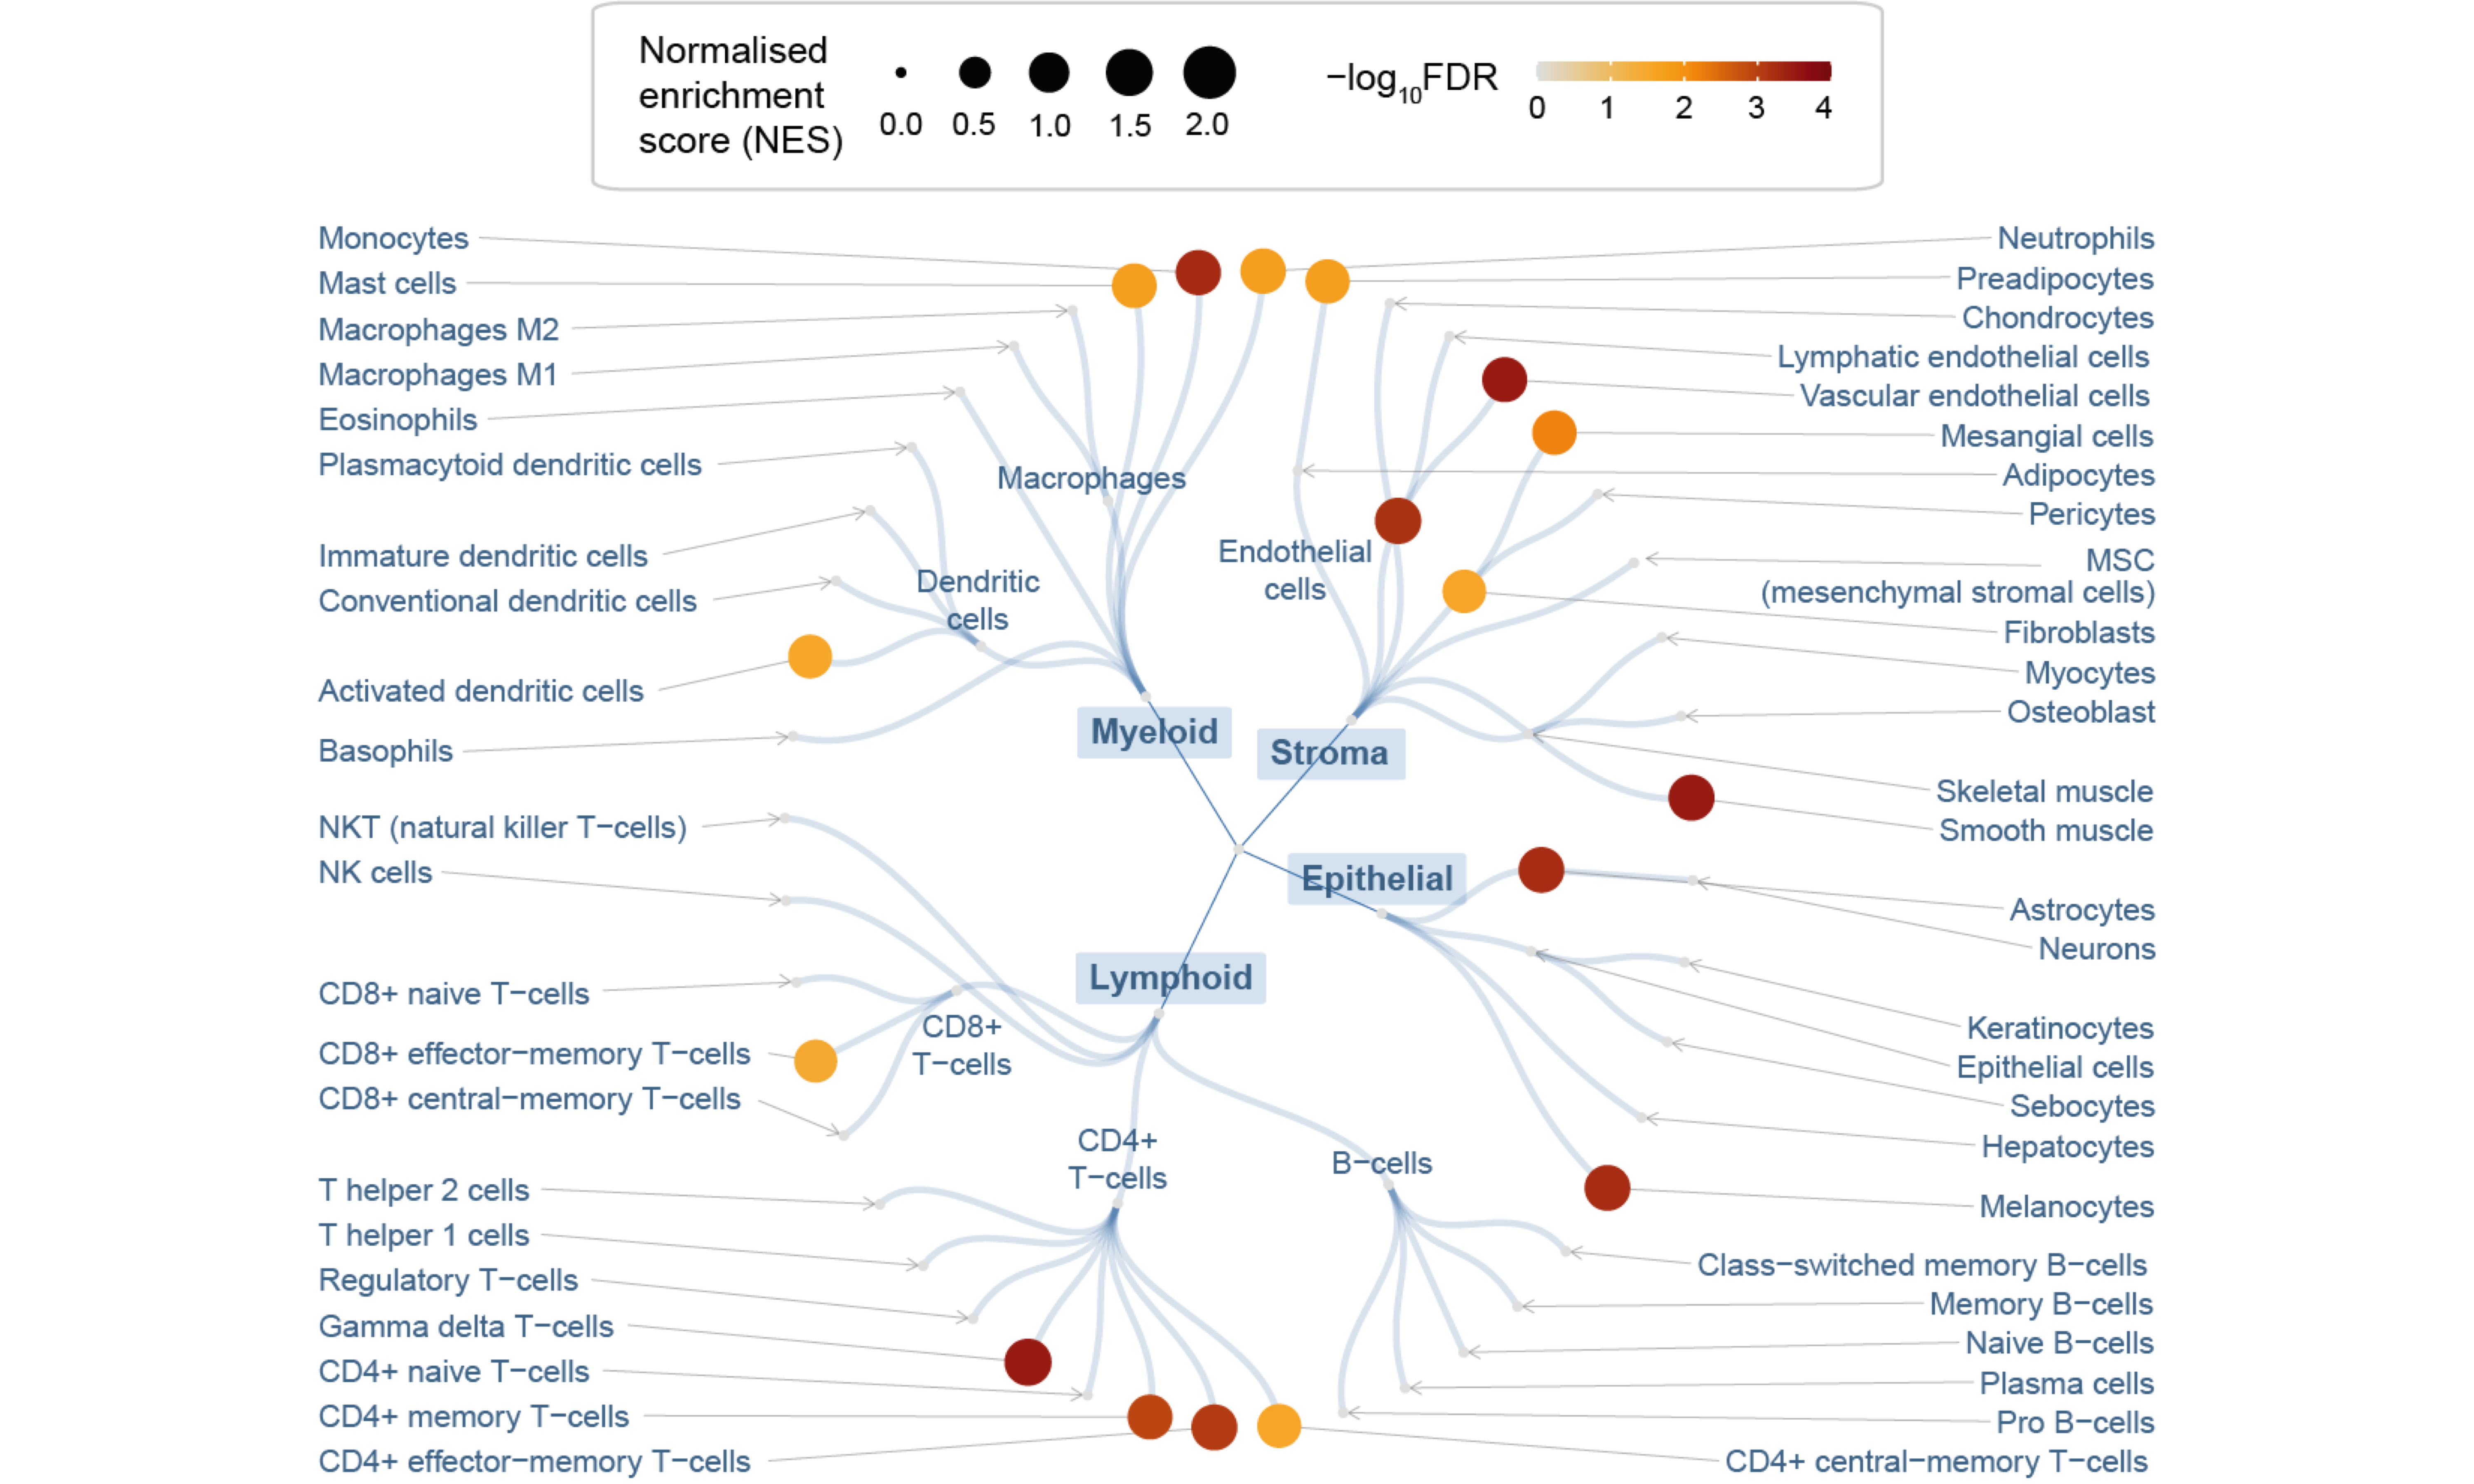
Figure 4.1: Circular overview of cell type enrichments, with nodes sized by the normalised enrichment score (NES) and colored by the enrichment significance (FDR) calculated using gene set enrichment analysis (GSEA).
Notably, the column Namespace refer to the cell lineages (Epithelial, Lymphoid, Myeloid and Stroma).