Section 2 Prioritised targets
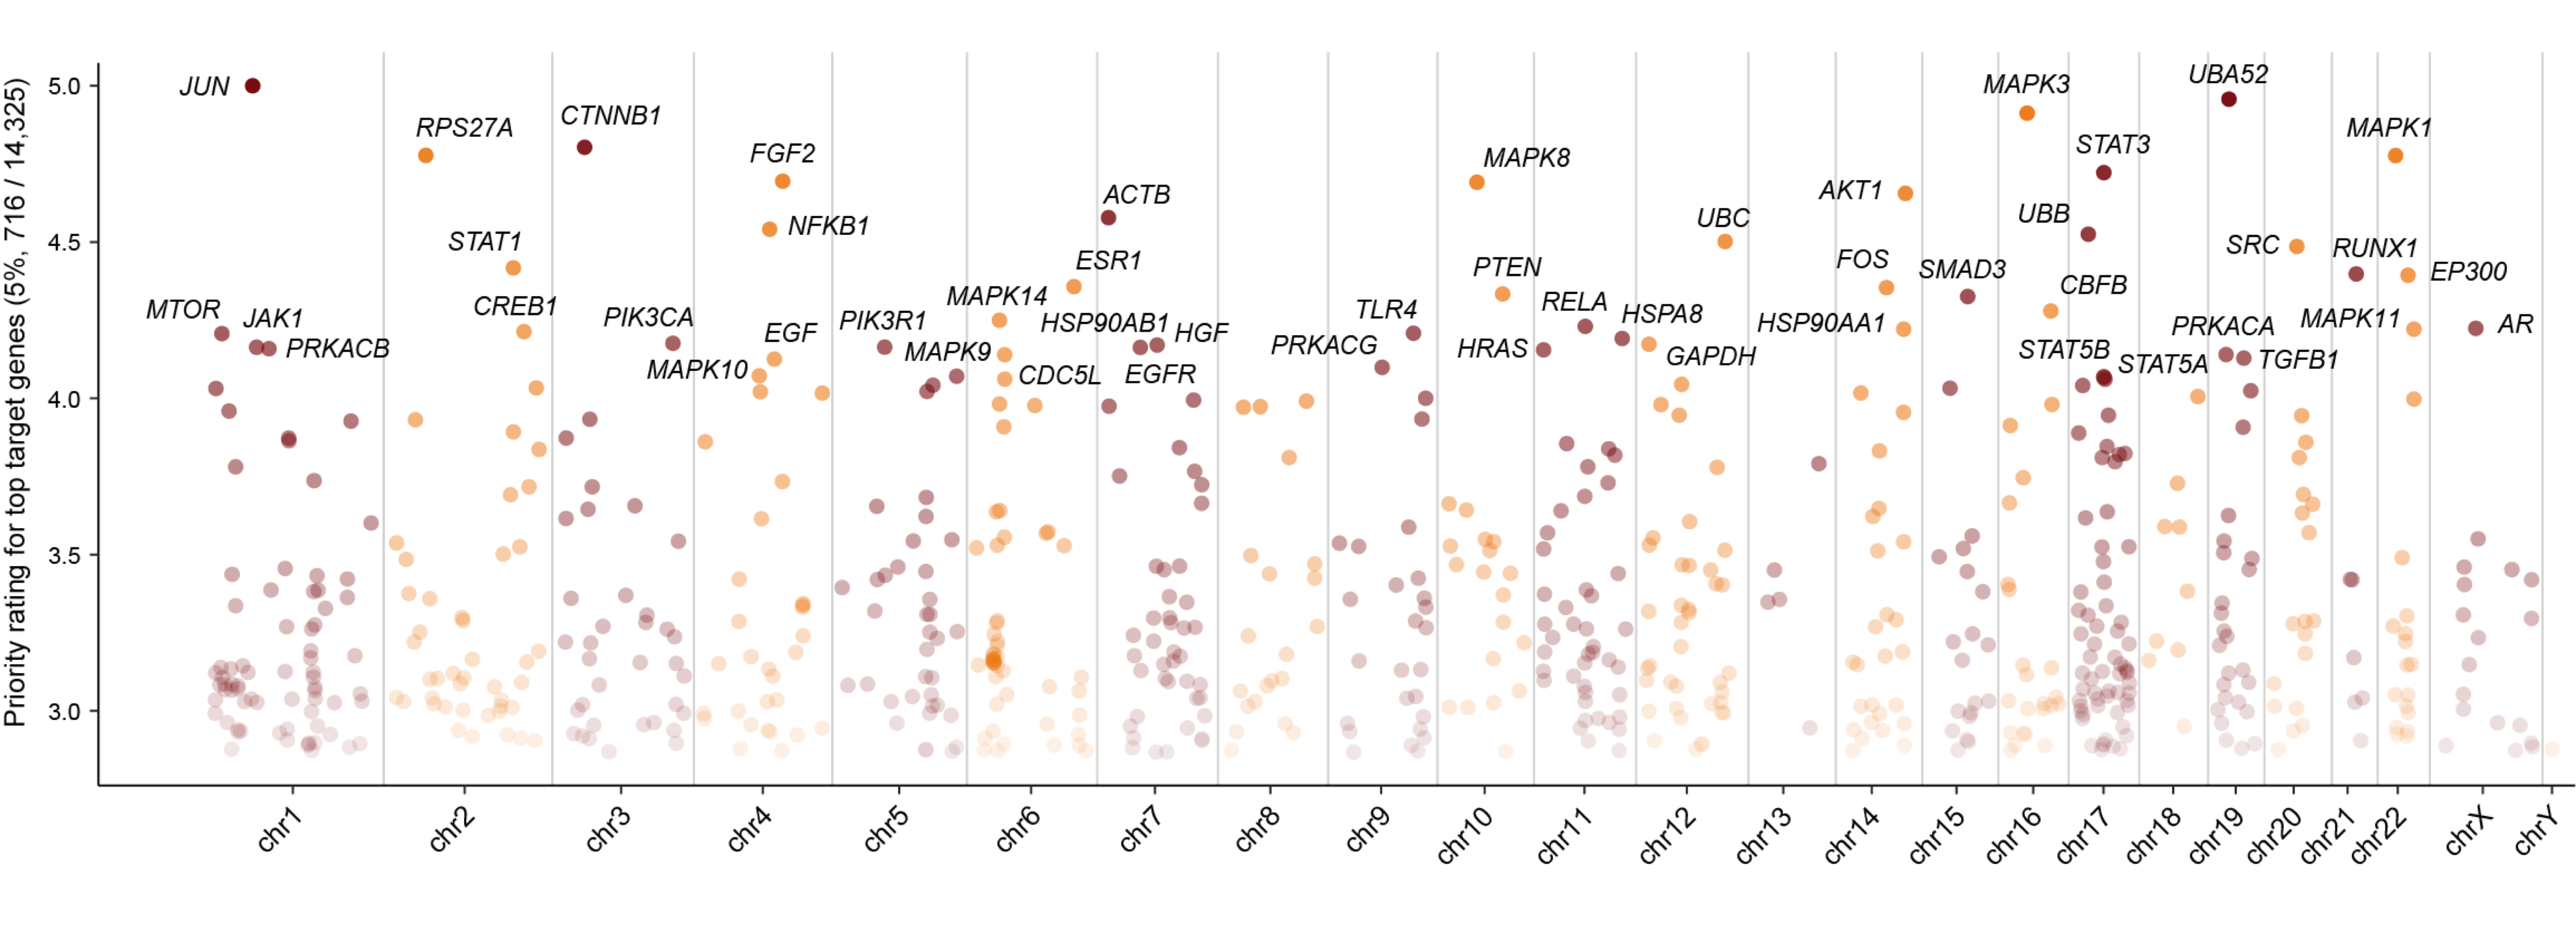
Figure 2.1: Manhattan plot illustrating priority rating (y-axis) for top 5% target genes (color-coded by chromosomes; x-axis), with top 30 labelled.
Notably, genes are ranked by priority rating (scored 0-5; see the column Rating).